

Showing posts with label benchmarking. Show all posts
Showing posts with label benchmarking. Show all posts
Monday, July 6, 2009


Monday, April 13, 2009
Energy Disclosure
Benchmarking has been a popular way to compare your home's energy use with those around you.
And as technology increases, comparisons are easier to make and more accurate. However, the article in Home Energy Online's March/April Editorial asks what role privacy should play within growing comparisons. See their message for yourself at: http://www.homeenergy.org/blog.php?id=45For the purposes of the article, several different types of energy measuring outcomes were discussed. The article outlines energy comparisons for:
- Real Estate - making the utility bills available to home buyers
- Benchmarking residential water use - highlighting the city of Austin Texas' bold move of "exposing the ten largest residential water users."
- The article even brings up the fact that most utility companies (with outdated billing machines)cannot provide the data to benchmark energy/water/gas...etc. within their customers.
So which is more important? Privacy or being able to gauge your energy use? While privacy is important, and name-shame techniques are harmful, I believe there is some use in being able to compare your energy use with others around you. I mean, I try and turn the water off while brushing my teeth...but I would want to know if my water bill was super high, then I could target specific areas and really make a difference.
It all comes down to you, your personal preference. Should you compare your energy/resource use with others or is it an invasion of privacy?
Friday, January 30, 2009
Got Air Flow?

Since we all can't live in beautiful spaces where the temperature is always perfect and there is a soft sea breeze blowing in the afternoons.
Most of us...just move to southern California, and while we can't complain too much about the weather this year (while it has been strange, it hasn't really been all together too hot OR too cold...) most homes aren't being heated or cooled sufficiently. If there are hot or cold spaces in your house, there are tons of suggestions I have given you over the course of this blog to diagnose/fix them. Here's to one more... (but let us recap a bit first) If you have hot and cold spots in your home, consider:- performing a home benchmarking exercise in which all of the 'orifices' in your home are checked for 'leakage.' If you can't/won't/are too lazy to do this, you can always contact a heating or air specialist or even expert company to do this for you.
- making sure that all parts of your home are "Weatherized" - meaning that everything is insulated properly, weather-stripped, sealed...
- making sure that your ducts are fully functioning and not leaking or anything. This can also happen if you have recently had work done on the house that required workers to go up into the attic - more often than not they knock something loose unknowingly - that's why you don't have your rat guy fix your ac - they are horses of completely different colors.
- making sure your system is running at the government mandated efficiency level. This may mean replacing a dinosaur of a unit or as easy as asking for a tune-up.
"step3 Check to make sure that all of the air registers are open throughout the house. Air registers are the grill-like vents that are in each room to release the warm or cool air. Air supply registers have a small lever to open or close the vent. Air return registers don't have the lever, but it's important to make sure that all registers are unobstructed by furniture, drapes or clutter. Step4 Try simply adjusting the lever on the air register in any room that is too hot or too cold. Sometimes partially closing a vent on a register in a small room that needs less air flow will force more air into a larger room, making it more comfortable."Wishing all a happy breeze in your home...or something like that.
Tuesday, November 4, 2008
Audit Your Home Scout Style
Even the boy scouts are concerned about saving energy! (I found this amusing, I mean I don't know why they wouldn't be, it seems to fit with their overall mission, but ...really? AND on top of that, this 8 page worksheet feels an awful lot like homework)
It is generally a good idea to audit your home, or test how much energy you are both using and possibly wasting. This can be done many different ways. Some people prefer to 'benchmark' or to compare their home energy usage to similarly sized homes near them. Others prefer to call out professionals who do various measurements - occasionally using thermo-detection devices to determine where air is escaping. The scout's audit falls somewhere in between. It is a fairly easy way to do it - print out page 8 (it has a bunch of check boxes) and go down the list. It requires things that everyone has in their home and gives you a start to finish place to start measuring your energy. The toilet paper thing, I thought was amazingly easy (and cool) who would think to see if toilet paper flaps in the breeze? An interesting approach and worth trying for that if nothing else.
So, go to this link: http://www.usscouts.org/mb/worksheets/Energy.pdf ignore the first 7 pages - that part sounds like a lot of work. Look at page 8. It's a one page audit of your home. Is it rocket science? No. bUt, also the results...not 100% accurate. Take it into consideration though, it's a heck of a lot cheaper than getting Darth Vader and his van of expensive machinery out to 'scan' your home. Plus, why weatherstrip if you don't need to?
And if you have a scout, maybe you can rack up some extra points? It's a pretty cool looking merit badge. Or at the very least you can say that you're prepared.
It is generally a good idea to audit your home, or test how much energy you are both using and possibly wasting. This can be done many different ways. Some people prefer to 'benchmark' or to compare their home energy usage to similarly sized homes near them. Others prefer to call out professionals who do various measurements - occasionally using thermo-detection devices to determine where air is escaping. The scout's audit falls somewhere in between. It is a fairly easy way to do it - print out page 8 (it has a bunch of check boxes) and go down the list. It requires things that everyone has in their home and gives you a start to finish place to start measuring your energy. The toilet paper thing, I thought was amazingly easy (and cool) who would think to see if toilet paper flaps in the breeze? An interesting approach and worth trying for that if nothing else.
So, go to this link: http://www.usscouts.org/mb/worksheets/Energy.pdf ignore the first 7 pages - that part sounds like a lot of work. Look at page 8. It's a one page audit of your home. Is it rocket science? No. bUt, also the results...not 100% accurate. Take it into consideration though, it's a heck of a lot cheaper than getting Darth Vader and his van of expensive machinery out to 'scan' your home. Plus, why weatherstrip if you don't need to?
And if you have a scout, maybe you can rack up some extra points? It's a pretty cool looking merit badge. Or at the very least you can say that you're prepared.
Thursday, June 12, 2008
How Does Your Home Measure Up?
Have you ever wondered if you are doing enough of your part to save energy during the hot summer months? Do you wonder how your neighbors are doing?
Homeenergy.org published an article entitled “Comparing Your Home’s Energy Use to Others,” which can be found on their page http://www.homeenergy.org/consumerinfo/benchmarking-energy-usage.php.
One of the easiest and low-tech ways to determine an estimate of your home’s energy usage is benchmarking. In the article, the “do-it-yourself” section provides a section on what benchmarking is and how to do it. What is is: Benchmarking is a way to roughly compare the energy your house is using to the energy used by similar houses near by.
It is an easy to do, somewhat accurate way to get an idea of how energy efficient your home is.
If you want to do this manually, as described in the Home Energy article, you will need to know how much fuel you used last winter, the square footage of the heatable space in your house and about how cold the weather was. However, if you are like me and try to avoid math, you can head over to http://hes3.lbl.gov/hes/hes.taf?f=top. This takes us back to a very helpful web page, The Home Energy Saver web site. This site will give you an average electrical bill for homes in your area (found by typing in your zip code). Then, the web page will also generate a possible bill if energy saving appliances and techniques were used.
In my case, our zip code is 91723.
 The average Home Energy Bill for Homes in my zip code is $1,314.
 The average Home Energy Bill for Homes in my zip code is $1,314.
The Home Energy Bill with Energy Efficient appliances/precautions is $899.
That's a savings of $415 a year.
If that is enough information for you, you can stop there. But if you want to see how your energy bill can look more like the lower estimate, there are questions on the bottom section of the page that you can answer that will give you a ‘prescription’ of appliances to change out or upgrade to impact your bill. These questions include describing the type of insulation in your home, the number of windows and even the geographical direction your home faces. After answering basic questions like these, the website will then generate a calculation of possible upgrades you can make to your house and the amount of money those upgrades would save you (with the payback amount and time period already factored in). Upon completing the questions and calculations you will be taken to a “results” page where you can then map your homes carbon footprint. This was very interesting to me. According to http://www.carbonfootprint.com/carbonfootprint.html, a carbon footprint is“is a measure of the impact human activities have on the environment in terms of the amount of greenhouse gases produced, measured in units of carbon dioxide.”
The explanation continues as the web page splits the carbon footprint term into a primary and a secondary footprint (explaining corresponding calculations used in the definitions). The whole carbon footprint is found by adding the primary and secondary traits together. The primary footprint is the direct usage of fossil fuels (like driving in your car, or taking a flight). The secondary footprint comes from products we buy and how long it is going to take for the products we buy to decompose. The carbon footprint calculator on energy website calculates your “carbon footprint” a little bit differently because it is examining the energy usage of your home, not you as an individual. It also has a mapping system so that you can compare your energy usage with the median usage of homes near you (in your same zip code) as well as others on the map. To see the numbers the calculator uses as well as the methodology please visit http://hes3.lbl.gov/hes/footprint_map/index.taf?session_id=1110331&_UserReference=5621E7A2A0F286594851845B. After you have input your information and viewed the map of your zip code, the “summary stats” tab allows you to see your energy consumption on a graph compared to “Annual Metric Tons of Carbon Dioxide Emissions per Home” other homeowners, as well as a line representing homeowners across the United States.
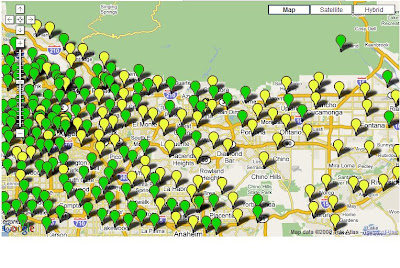
This is the ‘pins’ that show how the energy usage in my area. The green represents 0-5 levels of carbon emissions, and the yellow represents 5.1-15 levels and the red represents 15.1-999. Green is a great level of carbon emissions, yellow is ok, and red levels should be avoided.
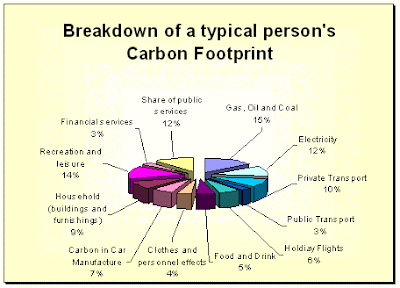
If you are interested in finding out your carbon footprint for other than your primary footprint (like how much carbon is utilized during travel or household waste, visit: http://www.coolcalifornia.org/ A carbon footprint, usually looks like this:
They give options to help reduce your carbon footprint: “Tips to Reduce Your Primary Footprint” according to http://www.carbonfootprint.com/carbonfootprint.html
Carbonfootprint.com also provides tips to reduce the secondary footprint
- When traveling for Holidays, they recommend avoiding air travel – as it uses more fuel than travel by land
- Utilize renewable energy or energy saving appliances as much as possible.
- “Try solar water heating – this can reduce your gas bill by up to 70% over a year.”
- Use public transportation as much as possible.
- Also, car sharing reduces your impact.
There are many easy ways to reduce your impact on the environment, and also save money off of your energy bills. Why not do something easy and helpful? Stay posted for more information about saving money on your electric bills!
- Pay closer attention to the materials you buy and the processes used to make them. So, for example, they recommend drinking bottled water because it is safe to drink tap water in most counties and recycling bottles adds to emissions.
- Buy as locally grown/made as possible. If local wine is produced, there will be less miles traveled, and therefore less emissions. The same goes for clothing. If clothes have to travel more than 1,000 miles, that is a large percentage of your footprint.
- Eat less red meat and avoid any goods that have unnecessary packaging.


Subscribe to:
Posts (Atom)


